
Director-General Letter 2020/09/01
“Toward a Green Recovery - A thought on the summer of 2020”
Soon after the long rainy season that caused heavy rain disasters in Kyushu and western Japan was over at the end of July, the record-breaking extremely hot summer started in August. Now, August is over, but we are still having the "dangerous heat" days with temperature exceeding 35℃ or higher, even around 40℃ throughout Japan. The number of deaths from heat stroke in Tokyo in August exceeded 200, which is the highest number ever recorded in many parts of the world, extremely high temperatures and associated forest fires have been reported. On the other hand, once cumulonimbus clouds develop, localized torrential rains which exceeds 100 mm per hour have been reported here and there. Under the COVID-19 situation, many children and students all over the country cut their summer vacation short and started a new semester early after a long school closure. Under such circumstances, the number of students who suffer from heat stroke is increasing because they are forced to go to school wearing a mask all the time in the brutal heat. The extremely hot summers have been increasing in recent years. Based on the data of monthly mean temperature in August in western Japan from the Japan Meteorological Agency (JMA) for 75 years since 1946, I have found that this year marks the highest, and the 7 years since 2010 indeed rank in the top 10.
Why has it been so hot then? The direct cause is that the Pacific (Ogasawara) high, which is a dominant atmospheric air mass covering over and around Japan, is very strong and the weather continues to be fine. This high pressure system is strong because the convective activity (cumulonimbus activity) from the western tropical Pacific Ocean to south of Japan through the Southeast Asian monsoon region is very active, causing stronger updraft there, and stronger downdraft in the Pacific high region through the north-south dipole pattern of the atmospheric circulation. Active convective activity in the Asian monsoon region is also related to high sea surface temperatures from the tropical Indian Ocean to the western tropical Pacific Ocean. The sea surface temperature is now rising globally as shown in Fig. 1, and has risen by 0.5 ℃ over the last 10 years. The temperature rise in Japanese coastal waters is even greater, and the sea surface temperature just to the south of Japan has reached 30℃ this summer, which is exactly the same level of the tropical oceans, where typhoons and tropical depressions can easily be generated and developed. The warmed sea water around the Japanese archipelago has increased the amount of water vapor in the atmosphere, which in turn, led to a long and active Baiu front in July and brought unbearable hot and humid summer in August. The increase in water vapor also strengthens the regional greenhouse effect and makes it hotter near the ground. However, once the atmosphere becomes unstable, it sometimes causes heavy rainfall never experienced before. The poor catch of pacific saury is very likely due to the rise in seawater temperature near Japan. It is reported that the global rise in sea surface temperature, including in the vicinity of Japan, is the consequence of the "global warming" that appeared in the oceans caused by the increase in greenhouse gases represented by CO2. (IPCC, 2013) The frequent occurrences of high temperatures and related extreme weather events and phenomena taking place all over the world can even suggest that the global climate conditions are approaching a tipping point where drastic changes occur. The Paris Agreement aims to reduce CO2 emissions to zero by 2050 in order to limit the global surface air temperature increase within 1.5℃ and avoid crises associated with the tipping point. Regrettably, this goal seems unlikely to be achieved, under the “business-as-usual” economic growth with the conventional social system.
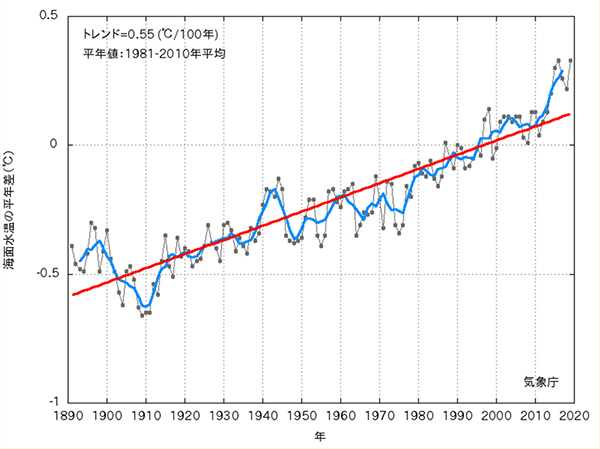
Figure 1: Long-term change of global annual mean sea surface temperature (JMA, 2020)
However, this COVID-19 has provided an unexpected opportunity to human society. It has been proved that global CO2 emissions, which was increasing until January of this year, have been reduced by about 17% (compared to the 2019 average) in the subsequent three months due to the global slowdown of traffic, transportation and industry by significant restraint of movement of people after February in order to prevent the spread of the COVID-19 infection. (Le Quéré et al., 2020). The authors of this paper pointed out that even by changing the means of transportation for commuting and business trips to bicycles and public transportation from private cars and by stopping the private jet transfers by the wealthy class, it is possible to significantly reduce CO2 emissions. The socio-economic recovery from the COVID-19 pandemic should not just be a V-shaped recovery that attempts to quickly return to its original state, but it should rather be aimed for "Green Recovery*" which seeks the possibility of transition to a more sustainable new society, set off by the inevitable changes in society and lifestyle which COVID-19 has brought us.
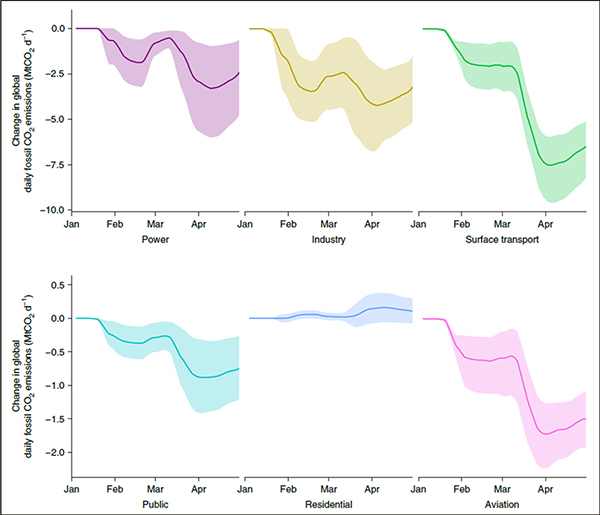
Figure 2: Change in global daily fossil CO2 emissions by sector (MtCO2 d−1). The uncertainty ranges represent the full range of our estimates.
Changes are relative to annual mean daily emissions from those sectors in 2019 (Methods).(Le Quéré et al., 2020)
(Translated by Megumi Arita, edited by Tetsuzo Yasunari)
(Acknowledgment: I am grateful to Ms. Megumi Arita for completing the English version of this message.)
<HAIKU>
夕涼みの夏を懐かしみつつ
<夕涼み線香花火の匂ひかな> 正岡子規
地球温暖化を何とかしよう
<水を打つ曲りさうなるこゝろにも> 笙鼓七波
<海洋に打ち水をせん暑き夏> 哲風
References:
- IPCC, 2013: Climate Change 2013: The Physical Science Basis. Contribution of Working Group I to the Fifth Assessment Report of the Intergovernmental Panel on Climate Change. Cambridge University Press, Cambridge, United Kingdom and New York, NY, USA, 1535 pp.
- Le Quéré C. et al., Nature Climate Change, 2020: Temporary reduction in daily global CO2 emissions during the COVID-19 confinement
- Green Recovery: https://www.climatechangenews.com/2020/04/09/european-green-deal-must-central-resilient-recovery-covid-19/
- Japan Meteorological Agency’s website: http://www.data.jma.go.jp/gmd/kaiyou/data/shindan/a_1/glb_warm/glb_warm.html