
COVID-19 affects social activities in Indonesia
Nina Yulianti, Kitso Kusin (Univ. Palangka Raya), Masafumi Ohashi (Kagoshima Univ.), Masahiro Kawasaki,
Manabu D. Yamanaka, Osamu Kozan (Res. Inst. Humanity & Nature) and Daisuke Naito (Kyoto Univ.)
The nitrogen dioxide (NO2) pollution over a region is linked to traffic, industrial and agricultural activities since NO2 is released by power plants, industrial facilities, motor vehicles and biomass burning. The column density of NO2 measured by a satellite is a first-level indicator of resident activity in the region. For example, recent Tropomi instrument on board the Copernicus Sentinel-5P satellite has shown a decline of air pollution over northern Italy and Chine coinciding with its nationwide lockdown to prevent the spread of the Coronavirus disease 2019 (COVID-19). The spread led to the dramatic reduction in NO2 concentrations in all major cities of China between late-January and February 2020. The NO2 drop in late-January is visible on images of the satellite site, coinciding with the nationwide quarantine.[1]
About the pollution map, GOME-2/SCIAMACHY DOAS nadir data browser shows the reduction of NO2 concentrations over China and Indonesia between December 2019 and May 2020 in Fig. 1. The OMI/Aura/NASA data of Indonesia are summarized in Table 1 for the heavily polluted Jakarta and less polluted Riau of Sumatra. In Greater Jakarta, the drop in absolute amounts is not so clear due to the seasonal variation. When the seasonal variation is cancelled, NO2 was reduced to 60% of the average value of 2014 − 2019. The NO2 drop is also seen in the imageries of CREA, Fig. 2, which show the NO2 levels of March 12 − May 5 of 2020 and 2019.
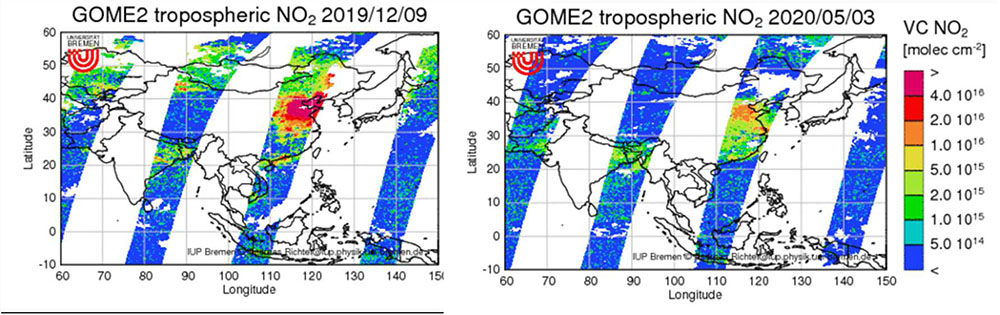
Fig. 1 Nitrogen dioxide NO2 change observed by GOME-2/SCIAMACHY DOAS nadir before and after COVID-19 in Jakarta and Beijin: December 9, 2019 and May 3, 2020
Note the orange areas over Jakarta and north China in the left picture turned to faint color in the right picture.
http://www.iup.uni-bremen.de/doas/scia_data_browser.htm
The nation-wide total number of the COVID-19 cases stood 36,406 on June 12, 2020. [2] In Greater Jakarta the total number was 8,355 or 25% of the nation-wide cases. Positive cases were reported in early-March 2020. Since then, the daily number has increased from 113 on April 2 to 1,111 on June 12.
Google reported Jakarta people’s visits and length of stay at work and residential places change compared to a baseline that is a median value during the 5-week period Jan 3–Feb 6, 2020.[3] Google has calculated these changes using the same kind of aggregated and anonymized data used to show popular times for places in Google Maps. The mobility data at workplace starts decreasing in early-March reaching 53% in late-May while that in residential increases up to 124%. In Riau province of Sumatra, the total number of cases is low, 120 (0.4% of nation-wide) on June 13. The NO2 column density does not drop, suggesting almost no effect of COVID-19 on traffics, industry and people’s activity. Google reported Riau people’s mobility change at workplace reaching 75% and in residential increasing to 112% in late May. These mobility changes are smaller than those of Jakarta. Note that these social data also depend on Ramadan for April 23 − May 23, 2020.
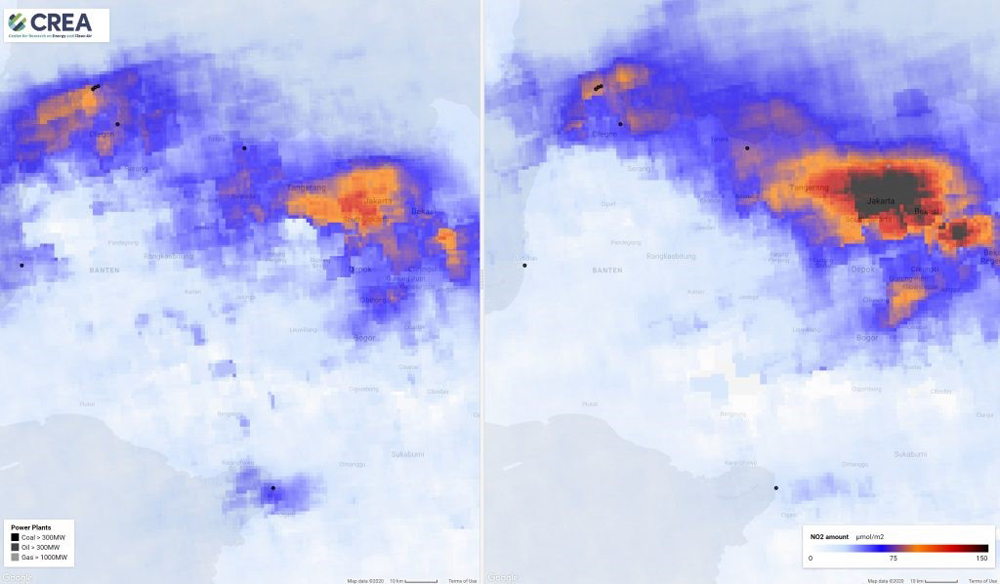
Fig. 2 Nitrogen dioxide NO2 levels of Greater Jakarta and Banten region: March 12 to May 5 (left) 2020 and (right) 2019,
https://energyandcleanair.org/covid19-lockdowns-across-southeast-asia/
Indonesian society consists of some number of large cities and a numerous number of small villages. We have investigated how COVID-19 affects those different types of local societies using the SIR numeric model.[4] This basic mathematical model is simply described by three differential equations.
N = S(t) + I(t) + R(t),
dS(t) / dt = − βI(t)S(t),
dI(t) / dt = βI(t)S(t) − γI(t),
dR(t) / dt = γI(t),
where N is total population, t time delay after the first patient, I(t) number of infectious, S(t) susceptible, R(t) recovery including removed, β an infection rate constant, and γ a recovery rate constant from infection. For these equations, a basic reproduction number, R0, is a measure of infection strength, which is given by:
R0 = Nβ / γ.
| Table 1. Tropospheric column density of NO2 before and after COVID-19 | ||
|---|---|---|
| column density in units of 1015 /cm2 | ||
| Month of 2020 | Jakarta, Java | Riau, Sumatra |
| January | 3.4 | 0.5 |
| February | 2.2 | 0.7 |
| March | 2.5 | 0.7 |
| April | 1.9 | 1.0 |
| May | 2.3 | 1.1 |
|
Data from OMI/Aura/NASA, https://disc.gsfc.nasa.gov/datasets?keywords=OMI&page=1 Note 1: The first COVID-19 case was reported in early-March. Note 2 The average value of NO2 in South Asia 2020 is estimated to be 2× 10¹⁵ /cm2 after Ul-Haq et al. Zia ul-Haq, Salman Tariq, Muhammad Ali, Advances in Meteorology, 2015, Article ID 959284, http://dx.doi.org/10.1155/2015/959284 | ||
According to the reported epidemiological statistics of China, Europe and Japan, R0 are presently (March 2020) estimated to be 5, 2-3 and 1.5, respectively.[5] This number can be reduced to R by an efficacy factor of (1 – c) that depends on lifestyle habits including social communication and distancing, washing hands, masks etc.,
R = R0(1 − c).
With proper prevention of epidemic, R of Japan was reduced to 1.06. Based on information about China, Europe and Japan, we assume in the present calculation that a) day of double infection is 10 days, b) γ is around 0.055 day-1 to calculate I(t) as a function of population, N = 5,000 for a village community and 1,000,000 for a megacity. Although small population density in village makes social distancing large, in the following calculation we assume that human relationship among people of the village community under closed circumstances is much closer than in the city, resulting in a larger (1 – c) value. For simplicity purpose, using a doubled R value for village as shown in Table 2, we numerically calculate epidemic curves in Fig. 3. The number of cases in village peaks on 6th day while 45th for city. Almost all residents in the village suffer from COVID-19 within two weeks while less than a half of people are infected in the city with a seven times slower infection speed. People in city have time to prepare against pandemic while village people do not. Since the local community of the village gets easily collapsed with chaos spread among residents, a small society should take very quick prevention against epidemic to save its community.
| Table 2. Results of epidemic curves of a model calculation for village and citya) | ||||||||
|---|---|---|---|---|---|---|---|---|
| Population | Area | SDb) | Reproduction | Infectious function, I(t) | ||||
| N | (km2) | (m) | number, R | max | day of max | total (T) | T/N (%) | |
| Village | 5,000 | 100 | 140 | 2.52 | 1,459 | 6 | 4,710 | 94 |
| City | 1,000,000 | 200 | 14 | 1.26 | 24,078 | 45 | 390,582 | 39 |
| a) day of double infection = 10 day corresponding Nβ = 0.07 day-1: day of half-recovery = 12 day corresponding γ = 0.055 day-1 b) Social Distance ~ (population density)‒1/2 = (Area/N)1/2 |
||||||||
References
- https://www.esa.int/Applications/Observing_the_Earth/Copernicus/Sentinel-5P/COVID-19_nitrogen_dioxide_over_China, Fan, C.; Li, Y.; Guang, J.; Li, Z.; Elnashar, A.; Allam, M.; de Leeuw, G. The Impact of the Control Measures during the COVID-19 Outbreak on Air Pollution in China. Remote Sens.2020, 12, art.#1613.
- https://covid19.go.id/peta-sebaran
- Google LLC "Google COVID-19 Community Mobility Reports". https://www.google.com/covid19/mobility/
- W. O. Kermack and A. G. McKendrick, Proc. Roy. Soc. (London) A, 115, 700 (1927), doi:10.1098/rspa.1927.011).
- References for basic reproduction numbers, R0 and R: S. Kado of Kyoto University, https://bit.ly/RADIT21KD20200327, Y. Liu, A. A. Gayle, A. Wilder-Smith, J. Rocklöv, J. Travel Medicine, 27(2), 2020, taaa021, https://doi.org/10.1093/jtm/taaa021, H. Okumura of Mi’e University, https://oku.edu.mie-u.ac.jp/~okumura/python/COVID-19.html
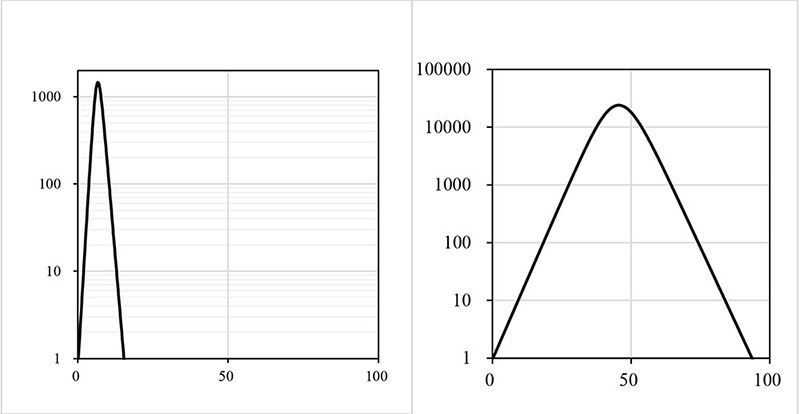
Fig. 3 Calculated epidemic curves in logarithmic scale for (left) small village N = 5,000 / R = 2.52, and (right) megacity N = 1,000,000 / R = 1.26 as a function of day after first case. See Table 2 for epidemic parameters.