Research Program
Supply Chain Project
Mapping the Environmental Impact Footprint of Cities, Companies, and Households
Abstract
A recent study in Nature showed that up to a third of biodiversity loss is driven by trade, and a body of other studies have identified the same pattern for greenhouse gas emissions, air pollution, and other environmental ills. Many environmental impacts worldwide are ultimately driven by consumption in developed countries. Considerations of remote responsibility, ecological footprint, and scope 3 emissions are now a standard part of the environmental policy discussion at many levels, from the UNFCCC to individual businesses and households.
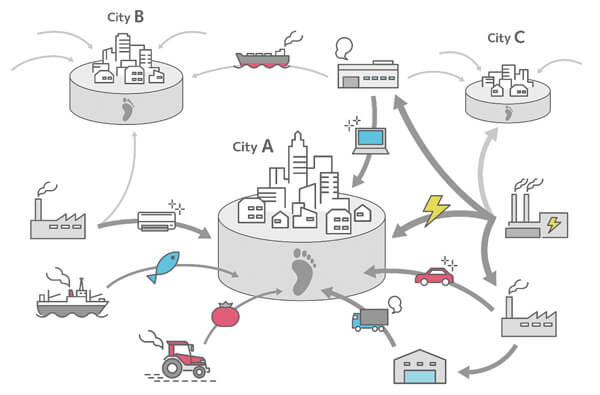
Providing better information to buyers and decision-makers can be a powerful way to reduce environmental pressures worldwide. The life-cycle analysis and supply chain analysis tools (multi-regional input-output (MRIO) models) used to analyze these remote effects in detail have benefited from significant advances in the past years with improving models and, more recently, the link of economic models to spatial (GIS) maps that locate more precisely how global supply chains link to particular emissions and biodiversity hotspots.
However, while existing work sketches out the broad picture, it still falls short of being detailed enough to help with many specific decisions. Existing supply chain analyses operate at the resolution of countries and broad economic sectors. In practice decision-makers at these levels often only have limited effective economic and judicial power. Many individuals, businesses, and local governments are seeking to reduce their total environmental footprint, but existing models have either too coarse resolution to be truly useful or require expensive and time-consuming modifications to inform specific decisions.
Unlike most studies that focus on environmental emissions and international trade, this is the first study to clarify the effect of global supply chains on environmental impacts. Further, in addition to countries and regions, we will estimate the environmental footprint of cities, companies, and households. The proposed project will make a major contribution and is expected to be of high interest to businesses, policymakers, NGOs, sustainability consultants, and researchers around the world. The project team has deep experience in supply chain analysis and environmental impact assessment.
Results
In 2018, we estimated the carbon footprint (CF) of 13,000 cities. Globally, we found CFs are highly concentrated in a small number of dense, high-income cities and affluent suburbs. 100 cities drive 18% of global emissions.
In most countries (98 of 187 assessed), the top three urban areas are responsible for more than one-quarter of national emissions. In 2019, we identified five key results about Japanese food diet from the Japanese CF household study. First, differences in household demographics (age and sex) do not explain variation in household food CF. Second, regional differences in food-related CF exist, but these are not the main explanatory factor of household differences. Third, household income and savings are weakly correlated with food-related CF. Fourth, there is 1.9 times higher food CF between the mean household in the lowest and highest quartiles. Finally, meat consumption is almost identical across the four quartiles, and it is the consumption of fish, vegetables, confectionary, alcohol, and restaurants that differentiates high and low CF households.
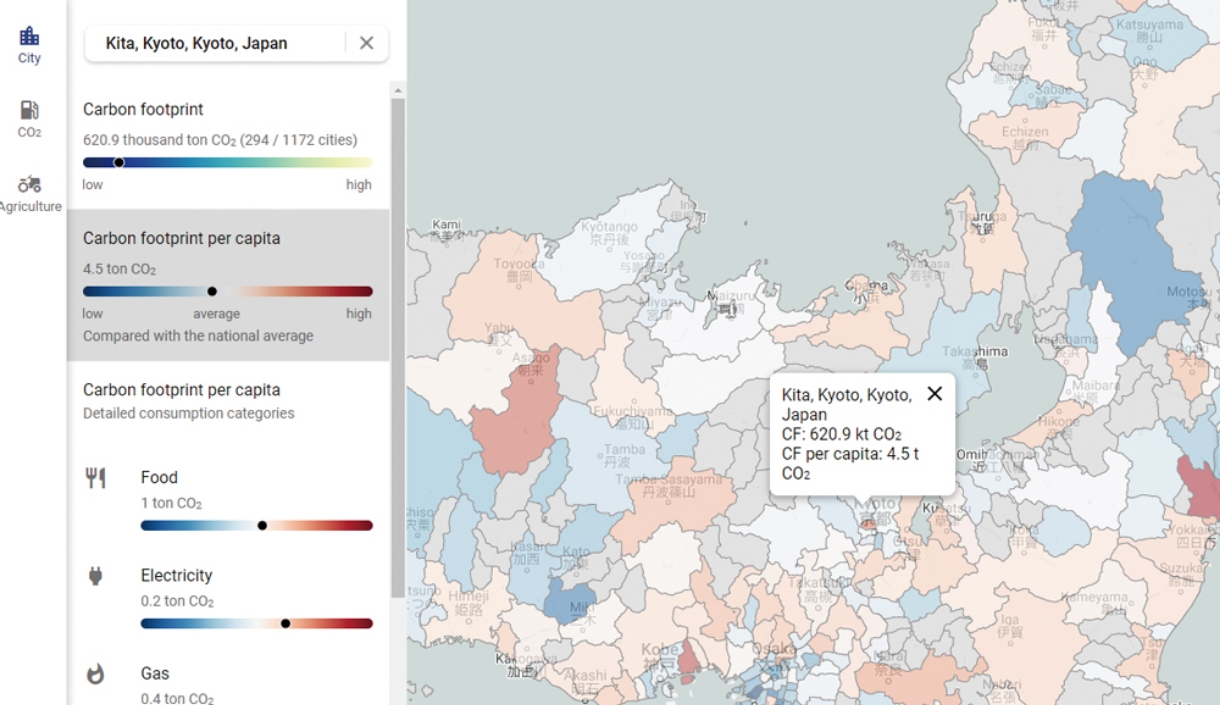
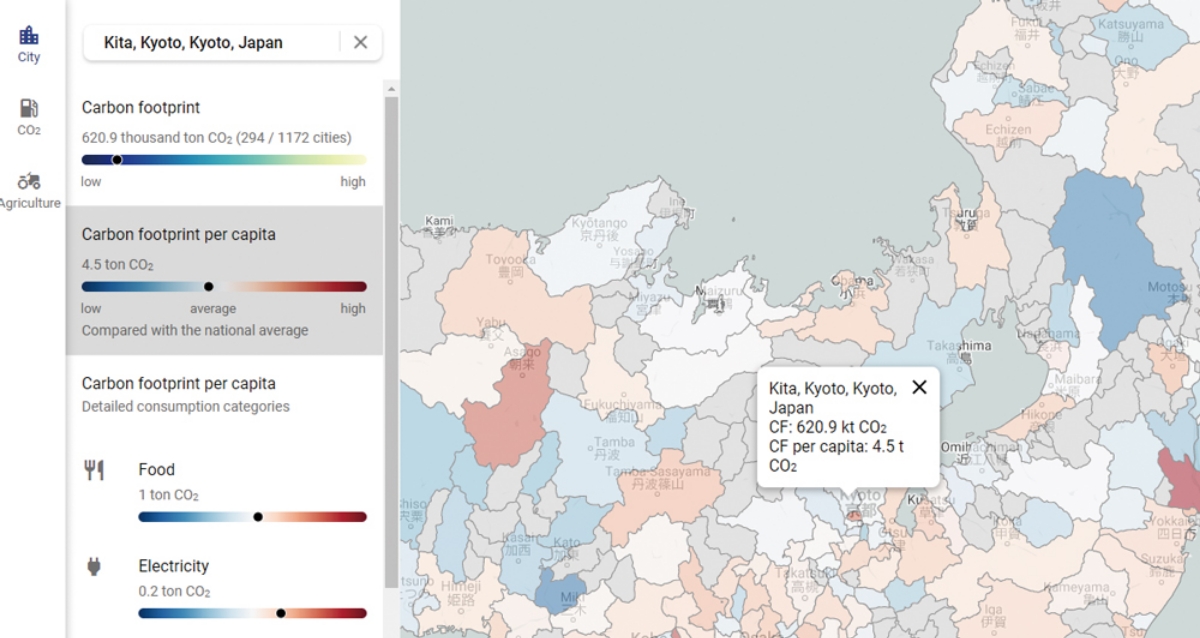
In 2020, we estimated the CF of Japanese and Indian cities. In the Indian study, we showed the eradication of extreme poverty does not conflict with ambitious climate change mitigation. However, our analysis suggests CF reduction policies within India need to target high-expenditure households, as they are responsible for nearly seven times more carbon emissions than low-expenditure households (living on $1.9 consumption a day). In the Japanese study, we constructed household CF inventories for 1172 cities using detailed consumer expenditure data and a Japanese domestic MRIO model.
In 2021, using remote sensing data and a MRIO model, we quantified and mapped the spatiotemporal changes in global deforestation footprints over 15 years (2001–2015) at a 30-m resolution. In addition, we quantified the reduction in household CFs for 25 factors associated with individual lifestyle choices and socioeconomic characteristics.
Member
Project Leader
KANEMOTO Keiichiro
RIHN/Tohoku University
Researchers at RIHN
NGUYEN Tien Hoang(Specially Appointed Assistant Professor Senior Researcher)
LEE Jemyung(Senior Researcher)
KATAFUCHI Yuya(Senior Researcher)
FAHMI Muhamad(Researcher)
FARABI-ASL Hadi(Researcher)
Li Xinmeng(Researcher)
Evaluation by an external evaluation committee
Research schedule
| 2017 | 2018 | 2019 | 2020 | 2021 | 2022 |
|---|---|---|---|---|---|
| IS/FS | FS/PR | FR1 | FR2 | FR3 | FR4 |