Government policy to decrease major emission sources led to reduction in PM2.5 in the Delhi NCR during 4-9 November 2023
This is our second report on air pollution situation in the Delhi National Capital Region (NCR). In the first we documented how the effect of crop residue burning (CRB) in the neighbouring states of Haryana and Punjab on increasing air pollution during 2-5 November was disproportionately attributed. The Delhi state and central government of India are well aware of the annual increase in PM2.5 and degraded Air Quality Index (AQI) in the Delhi NCR, and draft plans for air pollution control are in place.
While the media were publishing many reports on satellite detected fire hotspot counts due to CRB or vivid pictures of residue burning, the government enacted GRAP IV on Delhi NCR on 2nd Nov 2023. The Graded Response Action Plan (GRAP) is categorized into Stage I, Stage II, Stage III and IV, when the AQI ranges in 201-300 (poor), 301-400 (very poor), 401-450 (severe) or at a level greater than 450 (severe plus).
A group of international collaborators led by the Research Institute for Humanity and Nature (RIHN) team are conducting field campaign in the region of Punjab, Haryana and Delhi NCR since September 2023. A network of about 30 low-cost Compact and Useful PM2.5 Instrument with Gas sensors (CUPI-Gs) are making continuous measurements of PM2.5 and some of the related chemical species at time interval of minutes (RIHN news, 09 Nov 2023).
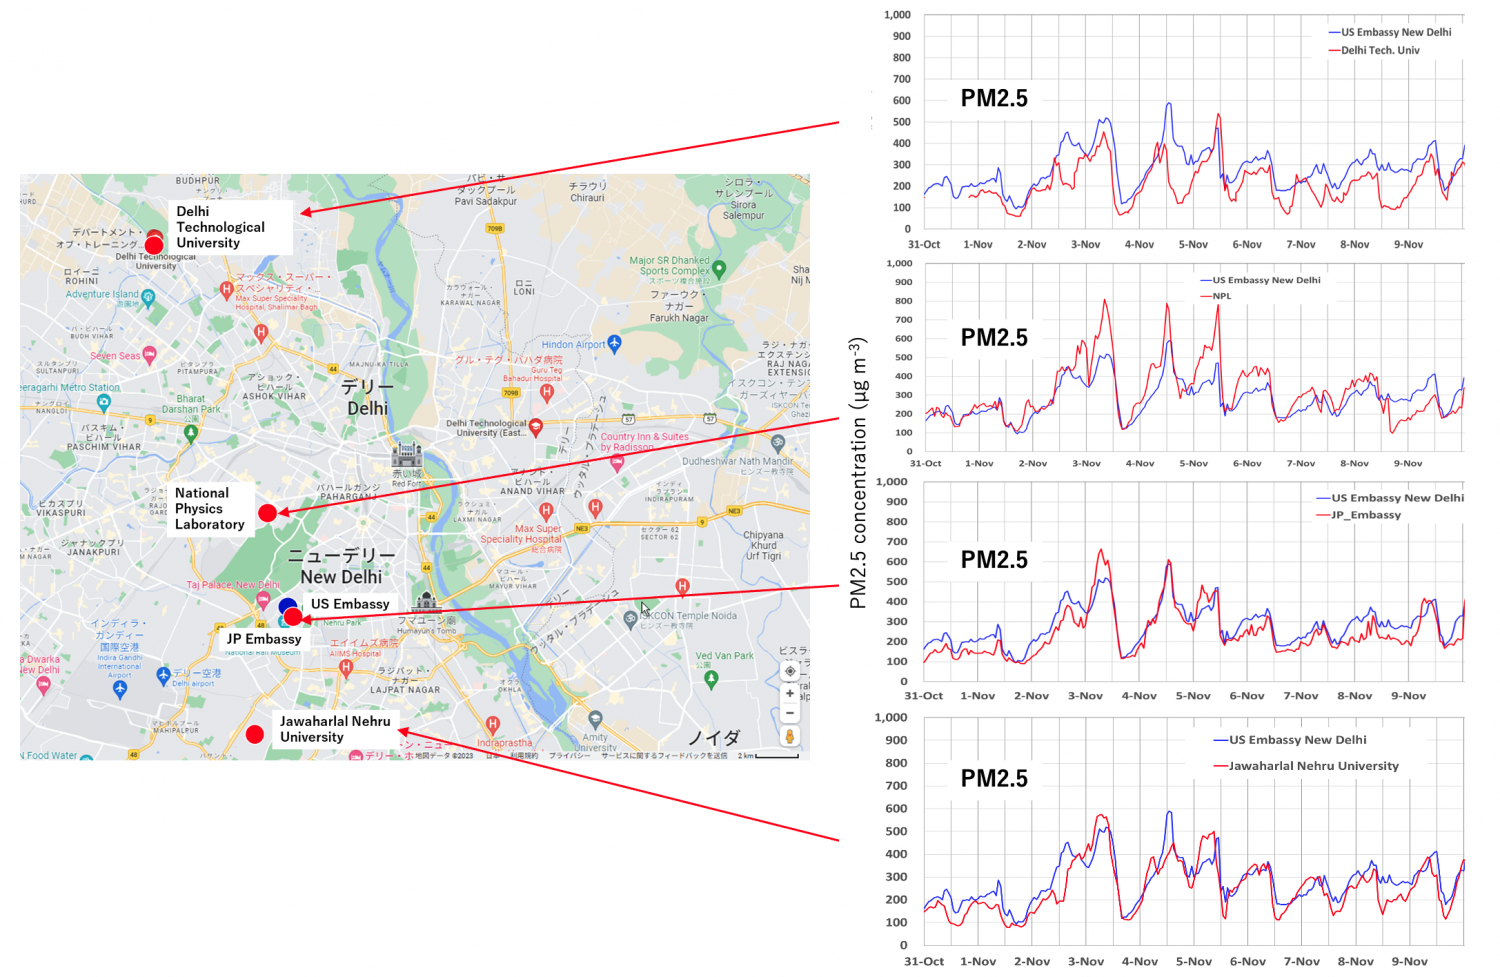
Figure 1 shows the measurements of PM2.5 at four sites in Delhi NCR. Daily mean PM2.5 alone increased from about 200 µg m-3 on 1st November or earlier to greater than 400 µg m-3 range on 2nd November and that persisted until 5th November. GRAP Stage IV was introduced on 5th November and our measurements show steady decline afterwards (Fig. 1). This is an excellent example of policymaking for the benefits of citizens.
Figure 1: Time series of PM2.5 measured at the CUPI-G sites in Delhi NCR during 01 - 12 Nov 2023. All sites data are plotted along with the measurement of PM2.5 at the US Embassy, New Delhi, employing a high grade instrument using beam attenuation method (BAM). Data subjected to final quality control (QA/QC).
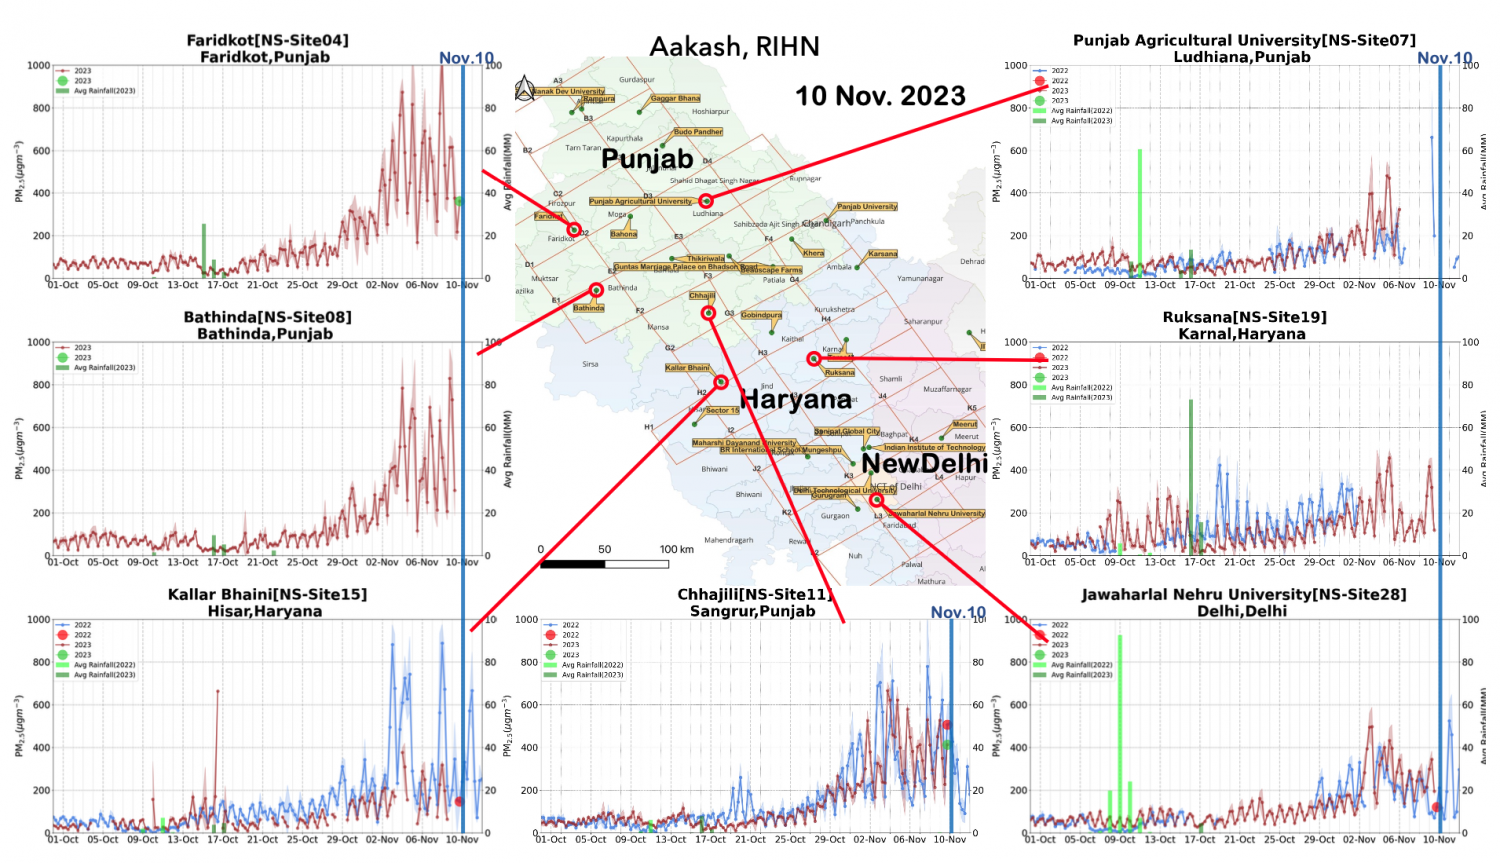
It could be said that the reduction in Delhi NCR PM2.5 level was a cause of lower CRB in Punjab and Haryana, but our measurements (Fig. 2a) and fire hotspots (Fig. 2b) tell a different story. In Singh et al. (2023) we have shown when the winds are from Punjab to Delhi during large scale CRB periods, the PM2.5 concentrations are very high in the source regions (Kallar Bhaini or Chhajili; blue lines in Fig. 2a) and a decayed peak PM2.5 values are observed at the sites in Delhi NCR (e.g., at JNU; Fig. 2a). However, preliminary analysis suggests that this year’s situation is appearing somewhat different (red lines in Fig. 2a); a low winds condition prevailed for a longer duration.
Figure 2a: Time series of PM2.5 measured at the CUPI-G sites in Punjab, Haryana and Delhi NCR during 01 Oct to 09 Nov of 2022 and 2023. We also depict the rainfall around the sites in both years by green bars, and the green/red dots are marked on the final day of measurements. Data subjected to final quality control (QA/QC).
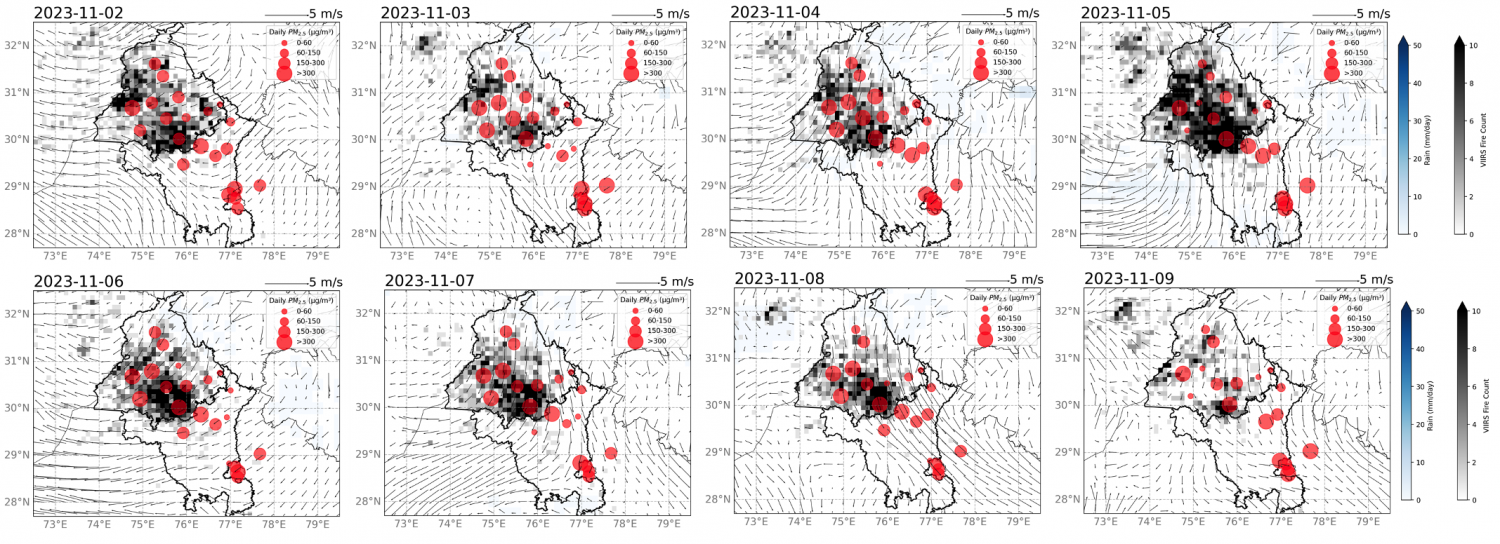
Figure 2b: showing the progression of daily mean PM2.5 at CUPI-G sites (red dots), VIIRS fire counts and rainfall maps, and NCEP-FNL wind vectors at 10 m height. Plots available on regular basis at : https://aakash-rihn.org/en/data-set/ or https://aakash-rihn.org/en/campaign2023-week10/
The FLEXPART model simulation (Takigawa et al., 2020), representing fire emission tracer from the Visible Infrared Imaging Radiometer Suite (VIIRS) fire detections, shows the transport of airmass were limited to the source regions of Punjab and Haryana, and transported to the southern and western area more frequently than to the Delhi NCR. These results are updated on near real-time with projection of airmass transport for the coming couple of days using forecasted meteorology from NCEP Global Forecasting System (https://aakash-rihn.org/en/data-set).
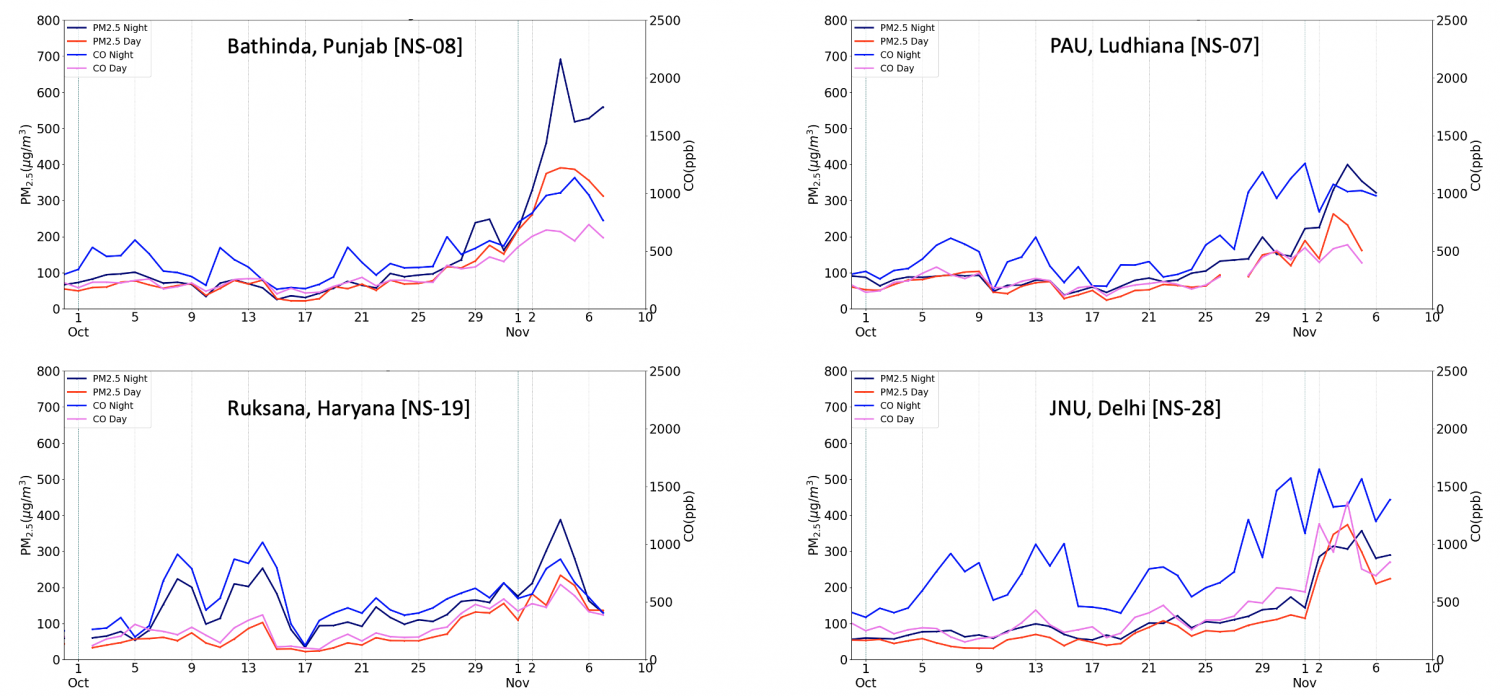
Our analysis shows contrasting behaviour in two markers for CRB, carbon monoxide (CO) and PM2.5. These pollutants have evolved quite differently in recent days as shown at 4 selected sites, with both PM2.5 and CO increasing rapidly on 02nd Nov 2023 at Jawaharlal Nehru University (JNU) and other sites in Delhi NCR, but values increased much more slowly in the source region in Punjab and Haryana (Fig. 3). The weather pattern trapped the air over Delhi NCR and prevented its dispersal during 2-9 Nov 2023 (Fig. 2a). This build-up has now alleviated by the governmental policy and avoided the crisis to last long due to the reduction in local emissions, as per our simple analysis of measurement from a network of sites.
Figure 3: Day (0600-1800 IST) and night (1800-0600 IST) time average values of PM2.5and CO at 4 selected sites. CO can be used as a tracer for (incomplete) biomass burning. Analysis based on data subjected to final QA/QC.
As Diwali festival in India is around the corner, hope measurements of a greater number of species with detailed chemical characterisation will be made, for tracking the emissions from fire crackers and other burning activities, such as sulphur (S) – a powerful tracer for the powder used in firecrackers (e.g., Sawlani et al., 2018). Our sincere wishes for a Happy Diwali, that is lightened up by a pollution free fresh air for all.
Aakash Project at the Research Institute for Humanity and Nature (RIHN), Japan is working closely with Indian counterparts to address the issue of "An Interdisciplinary Study toward Clean Air, Public Health and Sustainable Agriculture: The Case of Crop Residue Burning in North India".
Reference
RIHN news, Very high air pollution event on 2-5 Nov 2023 in Delhi NCR couldn’t be explained by crop residue burning. 08 November 2023; www.chikyu.ac.jp/rihn_e/news/detail/410/
Sawlani, R., R. Agnihotri, C. Sharma, P. K. Patra, A. P. Dimri, K. Ram, and R. Verma, The severe Delhi SMOG of 2016: A case of delayed crop residue burning, coincident firecracker emissions, and atypical meteorology. Atmos. Pollution Res. 10, 868-879 (2019). https://doi.org/10.1016/j.apr.2018.12.015
Singh, T., Y. Matsumi, T. Nakayama, S. Hayashida, P. K. Patra, N. Yasutomi, M. Kajino, K. Yamaji, P. Khatri, M. Takigawa, H. Araki, Y. Kurogi, K. Kuji, K. Muramatsu, R. Imasu, A. Ananda, A. A. Arbain, R. Khaiwal, S. Bhardwaj, S. Kumar, S. Mor, S. K. Dhaka, A. P. Dimri, A. Sharma, N. Singh, M. S. Bhatti, R. Yadav, K. Vatta, S. Mor, Very high particulate pollution over northwest India captured by a high-density in situ sensor network. Sci Rep 13, 13201 (2023). https://doi.org/10.1038/s41598-023-39471-1
Takigawa, M. P. K. Patra, Y. Matsumi, S. K. Dhaka, T. Nakayama, K. Yamaji, M. Kajino, S. Hayashida, Can Delhi’s pollution be affected by crop fires in the Punjab region? SOLA 16, 86–91 (2020). https://doi.org/10.2151/sola.2020-015